At its current growth rate of over 90% per year, China will pass the US in total broadband subscribers by late 2006 to become the largest broadband country in the world. The US has fallen to 19th overall in household broadband penetration, and is in danger of being passed by Slovenia in early 2007. Israel leads all Middle Eastern and African countries, and is the third country overall in broadband penetration. Hong Kong leads the Pacific Rim, with a broadband penetration rate of over 73%. Meanwhile, in December 2005 the US passed 65% in broadband penetration among active Internet users.
China will pass US in Broadband Subscribers by late 2006
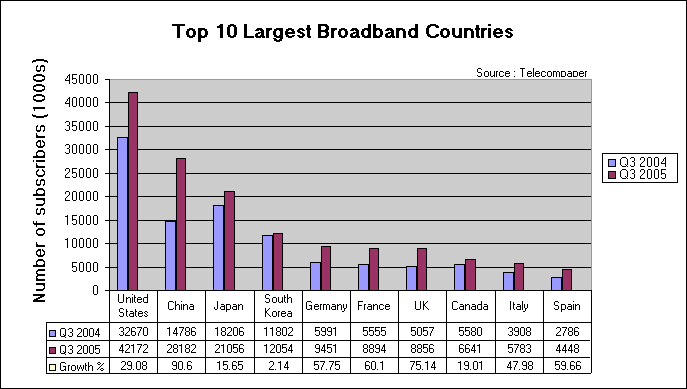
The US leads all countries with 42,172,000 total broadband subscribers (29.08% yearly growth), followed by China (28,182,000 subscribers), and Japan (21,056,000 subscribers). However, at its current growth rate of over 90% a year, China should overtake the US in total broadband subscribers by the end of 2006 (see Figure 1). China has a long way to go to match its neighbors in broadband penetration, however. China has a household penetration rate of 8.62% while the overall broadband penetration rate in Hong Kong is over 73%, South Korea is over 67%, and the US is 33.09%, as of Q3 2005 (see Figure 3).
Top 10 Broadband Countries (total subscribers)
Figure 1: Top 10 Broadband Countries (total subscribers)
Source: Telecompaper
US 19th overall in Broadband Penetration
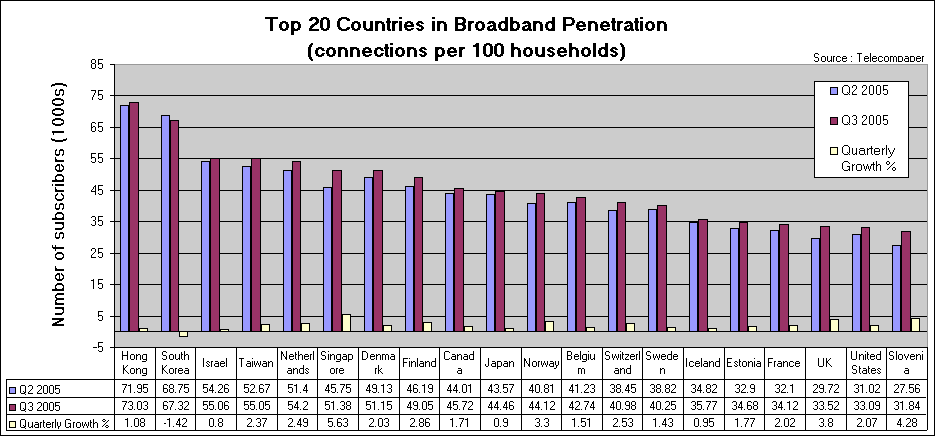
Hong Kong leads all countries in household broadband penetration at 73.03% (see Figure 2). South Korea follows at 67.32% but decreased for the first time, losing 1.42 percentage points from Q3 2004 to Q3 2005. Israel comes in third at 55.06% penetration and leads all countries in the Middle East and Africa for broadband penetration and usage. Of those countries in the top 20, Singapore leads in year-over-year growth at 5.63%, followed by Slovenia (4.28%), Finland (2.86%), Switzerland (2.53%), and the Netherlands (2.49%). At its current growth rate of 4.28%, Slovenia should pass the US in broadband penetration by early 2007, bringing the US down to 20th overall.
Top 20 Countries in Broadband Penetration (connections per 100 households)
Figure 2: Top 20 Countries in Broadband Penetration (connections per 100 households)
Source: Telecompaper
Hong Kong Leads Asia-Pacific Countries in Broadband Penetration
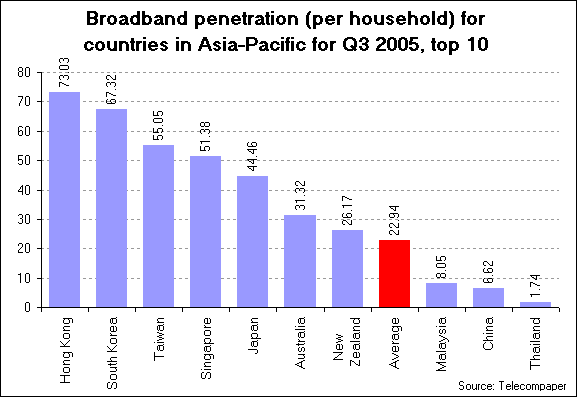
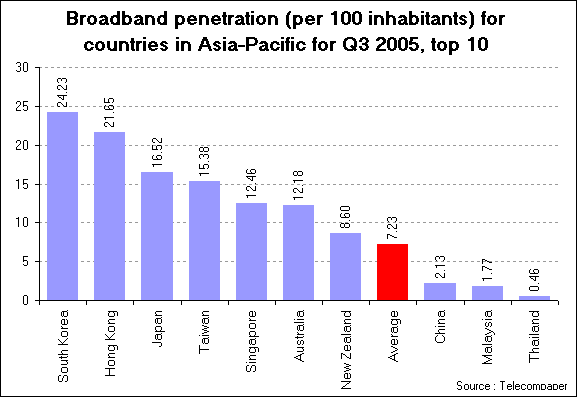
Hong Kong leads Pacific Rim countries in household broadband penetration at 73.03% as of Q3 2005 (see Figures 3 & 4). South Korea’s next at 67.32%, followed by Taiwan (55.05%), Singapore (51.38%), Japan (44.46%), Australia (31.32%), and New Zealand (26.17%).
Broadband Penetration (per household) in Asia-Pacific Countries, top 10
Figure 3: Broadband Penetration (per household) in Asia-Pacific Countries, top 10
Source: Telecompaper
Thailand (214.89%), Pakistan (160%), and India (125.83%) had the highest growth rates among Asia-Pacific countries. South Korea (2.14%), Hong Kong (15.42%), and Japan (15.65%) had the lowest growth rates in broadband connections in year-over-year growth. Two of these lower growth countries are approaching or exceeding 70% penetration, so it is not surprising that their growth rates have decreased. New Zealand broadband connections grew by 69.08% from Q3 2004 to Q3 2005, while broadband connections in Australia grew by 87.27% over the same period. China’s growth rate of over 90% (90.6%) from Q3 2004 to Q3 2005 is notable since it leads all Asia-Pacific countries in total number of broadband connections.
Broadband Penetration (per 100 inhabitants) in Asia-Pacific Countries, top 10
Figure 4: Broadband Penetration (per 100 inhabitants) in Asia-Pacific Countries, top 10
Source: Telecompaper
Home Connectivity in the US
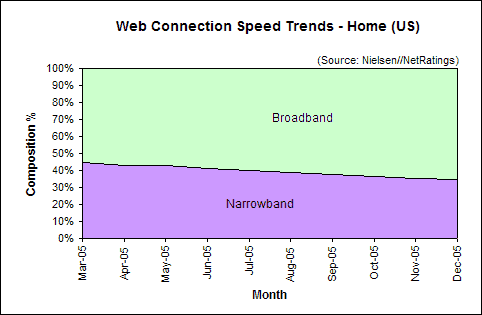
US broadband penetration grew to 65.57% in December. Narrowband users (56Kbps or less) now comprise 34.43% of active Internet users, down 0.68 percentage points from 35.11% in November 2005 (see Figure 5).
Web Connection Speed Trends – Home Users (US)
Figure 5: Web Connection Speed Trends – Home Users (US)
Source: Nielsen//NetRatings
Broadband Growth Trends in the US
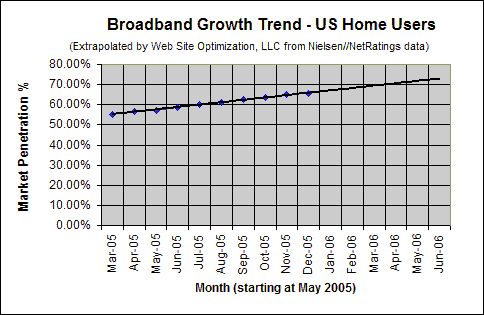
In December 2005, broadband penetration in US homes rose 0.68 percentage points to 65.57%, up from 64.89% in November. This increase of 0.68 points is less than half the average monthly increase of 1.28 points in broadband penetration over the last six months. At the current growth rate, broadband penetration among active Internet users in US homes should break 70% by late March of 2006 (see Figure 6). Note that with the recent slowdown in growth, this projection has been pushed further into the future with each passing month.
Broadband Adoption Growth Trend – Home Users (US)
Figure 6: Broadband Adoption Growth Trend – Home Users (US)
Extrapolated from Nielsen//NetRatings data
Work Connectivity
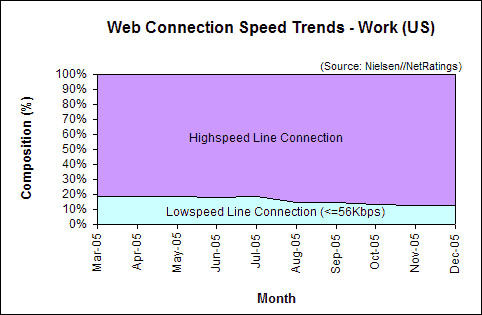
Most workers in the US enjoy high-speed connections to the Internet. Most use a high-speed line such as a T1 connection, and share bandwidth between computers connected to an Ethernet network. The speed of each connection decreases as more employees hook up to the LAN. As of December of 2005, of those connected to the Internet, 87.53% of US users at work enjoy a high-speed connection, up 0.18 percentage points from the 87.35% share in November. At work, 12.47% connect at 56Kbps or less (see Figure 7).
Web Connection Speed Trends – Work Users (US)
Figure 7: Web Connection Speed Trends – Work Users (US)
Source: Nielsen//NetRatings
Further Reading
- Nielsen//NetRatings
- Provides the US broadband data (percentage of active Internet users) for the Bandwidth Report.
- Telecompaper
- The “World Broadband Research Report – 2005 Q3” surveyed 75 countries in the Americas, Asia-Pacific, Europe, and the Middle East and Africa. Dec. 12 2005, Telecompaper (used with permission).
*Note that Nielsen//NetRatings new NetSpeed report differs from the previous Web connection data in two ways. First NetSpeed determines the connection speeds of the Digital Media Universe, which combines Web traffic, Internet applications and proprietary channels. The old Web connection data was based solely on Web traffic. The other difference is that the old Web connection data was based on panelists where the linespeeds are known. Since linespeeds don’t change often, if a panelist has an unknown linespeed, their previous month’s speed is taken.
The Bandwidth Report is featured monthly on URLwire – news of useful and unique web content since 1994.

