Overall, broadband grew by 0.95 percentage points in October, with 40.9% of US home users enjoying a high-speed connection. 59.1% of US home users dial into the Internet with “narrowband” connections of 56Kbps or less. The top four US states in broadband penetration also rank in the top five for per capita income, according to the Leichtman Research Group. In the US, cable has 64% of the broadband market versus DSL, the reverse of the worldwide trend of DSL over cable.
The charts and data below, derived from Nielsen//NetRatings and the Leichtman Research Group, show trends in connection speeds to the Internet for users in the United States.*
Home Connectivity in the US
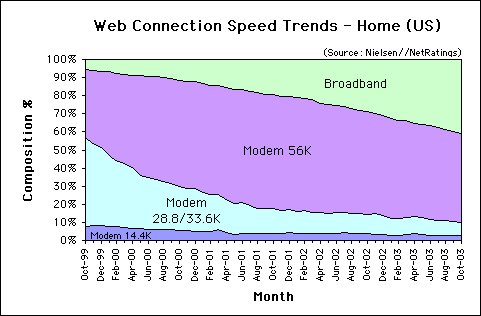
As of October 2003, most users in the US connect to the Internet using dial-up modems of 56Kbps or less. 49.1% use 56Kbps modems, 7% use 28/33.3Kbps, and 3% use 14.4Kbps modems. In total, 59.1% of home users in the US connect to the Internet at 56Kbps or less (see Figure 1).
Web Connection Speed Trends – Home Users (US)
Figure 1: Web Connection Speed Trends – Home Users (US)
Source: Nielsen//NetRatings
Broadband Growth in the US
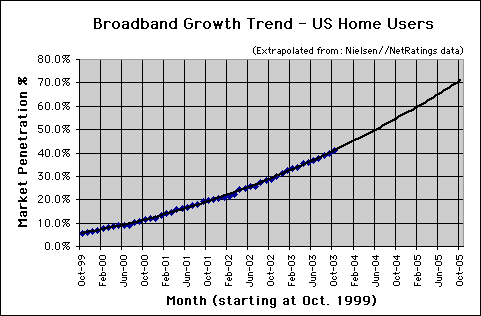
Broadband penetration in US homes increased by 0.95 percentage points in October. As of October 2003 broadband penetration was at 40.9%, up from 40% in September. This is higher than the average increase in broadband of 0.73 percentage points per month from October 1999 to September 2003. Extrapolating the data provided by Nielsen//NetRatings, broadband share in the US should exceed 50% by June of 2004 (see Figure 2).
Broadband Connection Speed Trend – Home Users (US)
Figure 2: Broadband Connection Speed Trend – Home Users (US)
Extrapolated from Nielsen//NetRatings data
Work Connectivity
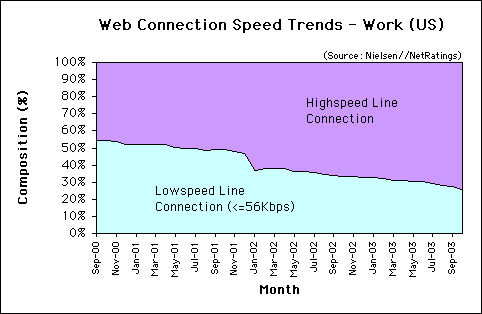
Most workers in the US enjoy high-speed connections to the Internet. Most use a high-speed line such as a T1 connection, and share bandwidth between computers connected to an ethernet network. The speed of each connection decreases as more employees hook up to the LAN. As of October of 2003, of those connected to the Internet, 74.1% of US users at work enjoy a high-speed connection, up 1.3% from 72.8% in September. 25.9% connect from work at 56Kbps or less (see Figure 3).
Web Connection Speed Trends – Work Users (US)
Figure 3: Web Connection Speed Trends – Work Users (US)
Source: Nielsen//NetRatings
Broadband Use Tracks Household Income
In the US, the states with the highest broadband penetration also have the highest per capita income, according to the Leichtman Research Group. Massachusetts, New Jersey, New York, and Connecticut led the nation in residential penetration of high-speed Internet subscribers at the start 2003. These states also rank among the top five states in per capita income, having an average per capita income 28% above the US average, and 58% above the four states (Kentucky, Montana, South Dakota and Mississippi) with the lowest broadband penetration.
US Cable Share Bucks Worldwide DSL Trend
In the third quarter of 2003, cable maintained its 64% share of the US broadband market versus DSL’s 36%. In the top four broadband states, 73% of high-speed Internet connections are from cable. This is the reverse of the global trend where 59% use DSL and 39% use cable.
Further Reading
- Iceland Gives Internet Warm Reception – US Broadband Penetration Now at 38.9% – September Bandwidth Report
- DSL dominates cable worldwide, according to the Bandwidth Report and the ITU. About 1 person in 10 has broadband (10.7%).
- Broadband Bounces Back with Record Quarter
- Cable and DSL providers added over two million high-speed Internet subscribers in the third quarter of 2003. Cable maintained its 64% share of the US broadband market versus DSL. Leichtman Research Group, Nov. 12, 2003.
- Northeast States Lead in High-Speed Internet Penetration
- The US states with the highest broadband penetration are also among the highest in per capita income. Leichtman Research Group, Oct. 30, 2003.
*Note: “Users” signifies people connected to the Internet.
The Bandwidth Report is featured monthly on URLwire – news of useful and unique web content since 1994.


